去年我们项目做了微服务1.0的架构转型,但是服务监控这块却没有跟上。这不,最近我就被分配了要将我们核心的微服务应用全部监控起来的任务。我们的微服务应用都是SpringBoot 应用,因此就自然而然的想到了借助Spring Boot 的Actuator 模块。 本篇是我在完成这个工单之后,对Spring Boot Actuator模块 学习应用的总结。在本篇文章中,你可以学习到: 1、Spring Boot Actuator 的快速使用入门 之后我还会介绍: TODO:SpringBoot 微服务应用集成Prometheus + Grafana实现监控告警
我们先创建一个demo应用。 你可以通过Spring Boot CLI 创建: 对应的maven依赖:
Spring Boot 提供了所谓的 endpoints (下文翻译为端点)给外部来与应用程序进行访问和交互。 打比方来说, 这些 Actuator 模块本来就有的端点我们称之为原生端点。根据端点的作用的话,我们大概可以分为三大类: 应用配置类:获取应用程序中加载的应用配置、环境变量、自动化配置报告等与Spring Boot应用密切相关的配置类信息。 度量指标类:获取应用程序运行过程中用于监控的度量指标,比如:内存信息、线程池信息、HTTP请求统计等。 操作控制类:提供了对应用的关闭等操作类功能。 详细的原生端点介绍,请以官网为准,这里就不赘述徒增篇幅。 需要注意的就是: 1、每一个端点都可以通过配置来单独禁用或者启动 2、不同于Actuator 1.x,Actuator 2.x 的大多数端点默认被禁掉。Actuator 2.x 中的默认端点增加了 我们可以通过以下配置,来配置通过JMX 和 HTTP 暴露的端点。 可以打开所有的监控点 启动DEMO程序,访问 下面,我会着重介绍几个比较重要的端点。
该属性可以使用以下值之一进行配置: 按照上述配置,配置成 是不是感觉好像健康信息有点少?先别急,那是因为我们创建的是一个最基础的Demo项目,没有依赖很多的组件。 上述截图取自官方文档 这是我另一个项目的 当如上的组件有一个状态异常,应用服务的整体状态即为down。我们也可以通过配置禁用某个组件的健康监测。 最终效果: 不同于1.x,Actuator在这个界面看不到具体的指标信息,只是展示了一个指标列表。为了获取到某个指标的详细信息,我们可以请求具体的指标信息,像这样: 比如我访问 你也可以通过下述方式访问单独一个logger, 启动项目,访问 访问 这个端点我个人觉得特别有用,方便我们在日常定位问题的时候查看线程的情况。主要展示了线程名、线程ID、线程的状态、是否等待锁资源、线程堆栈等信息。就是可能查看起来不太直观。访问 这个端点属于操作控制类端点,可以优雅关闭 Spring Boot 应用。要使用这个功能首先需要在配置文件中开启: 由于 shutdown 接口默认只支持 POST 请求,我们启动Demo项目,向
添加之后,我们需要定义安全校验规则,来覆盖Spring Security 的默认配置。 这里我给出了两个版本的模板配置:
2、Spring Boot Actuator 的一些重要的endpoints的介绍
3、如何通过Actuator 模块实时查看当前应用的线程 dump信息
4、如何通过Actuator 模块实时查看当前应用的堆信息
5、如何通过Actuator 模块实时修改当前应用的日志打印等级
6、…
什么是 Spring Boot Actuator

快速开始,创建一个Spring Boot Actuator Demo
spring init -d=web,actuator -n=actuator-demo actuator-demo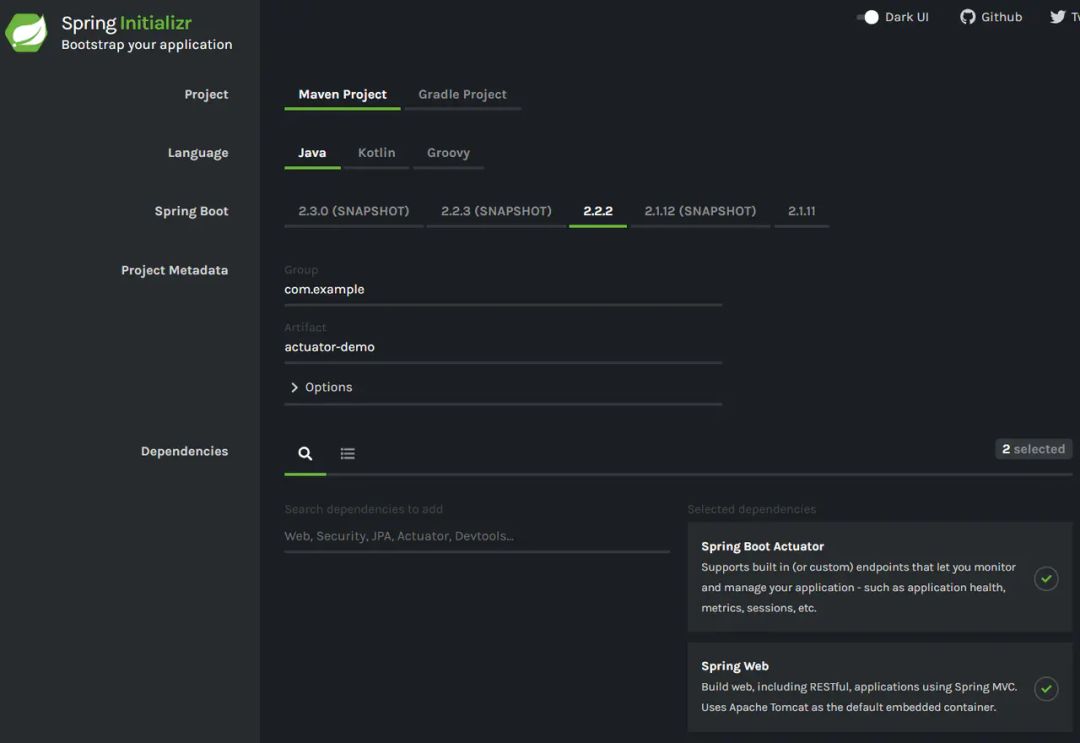
<dependencies>
...
<dependency>
<groupId>org.springframework.boot</groupId>
<artifactId>spring-boot-starter-actuator</artifactId>
</dependency>
...
</dependencies>
dependencies {
compile("org.springframework.boot:spring-boot-starter-actuator")
}
Endpoints 介绍
/health 端点 提供了关于应用健康情况的一些基础信息。metrics 端点提供了一些有用的应用程序指标(JVM 内存使用、系统CPU使用等)。
/actuator前缀。默认暴露的两个端点为 /actuator/health和 /actuator/info
端点暴露配置
Property
Default
management.endpoints.jmx.exposure.exclude
management.endpoints.jmx.exposure.include*
management.endpoints.web.exposure.exclude
management.endpoints.web.exposure.includeinfo,healt
management.endpoints.web.exposure.include=*
management.endpoints.web.exposure.exclude=beans,trace/actuator/*,当然如果有需要这个路径也支持定制。
management.endpoints.web.base-path=/minitor/minitor/*。
# "*" 代表暴露所有的端点 如果指定多个端点,用","分开management.endpoints.web.exposure.include=*# 赋值规则同上management.endpoints.web.exposure.exclude=http://localhost:8080/actuator,查看暴露出来的端点: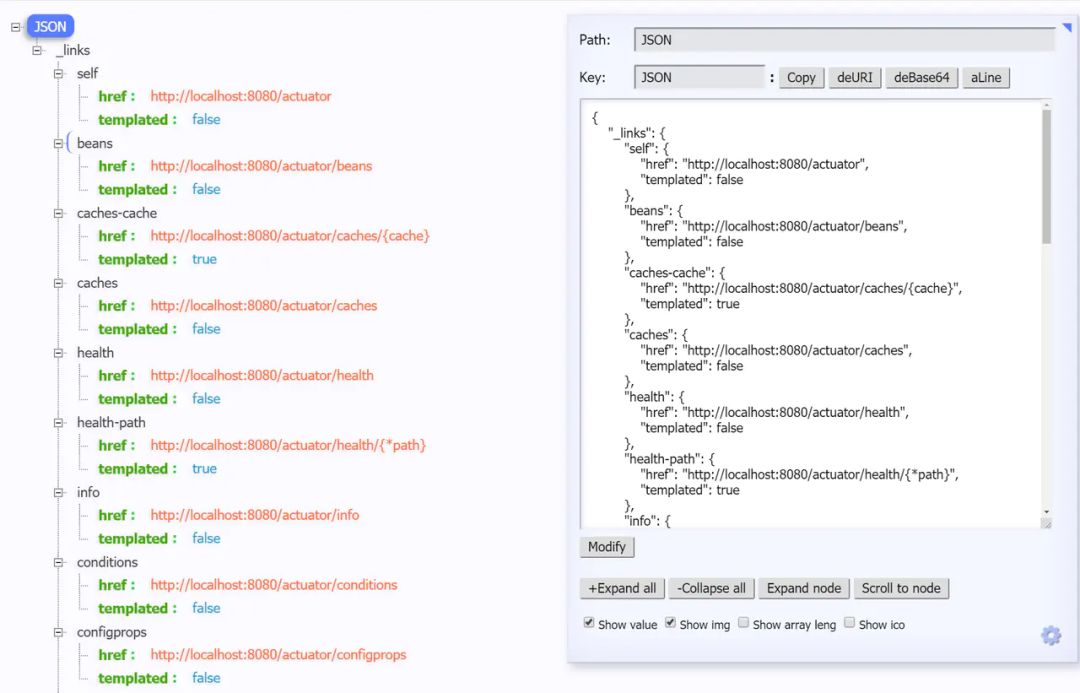

重要端点解析
/health端点
/health端点会聚合你程序的健康指标,来检查程序的健康情况。端点公开的应用健康信息取决于:
management.endpoint.health.show-details=always
Name
Description
never不展示详细信息,up或者down的状态,默认配置
when-authorized详细信息将会展示给通过认证的用户。授权的角色可以通过
management.endpoint.health.roles配置
always对所有用户暴露详细信息
always之后,我们启动项目,访问 http://localhost:8080/actuator/health端口,可以看到这样的信息: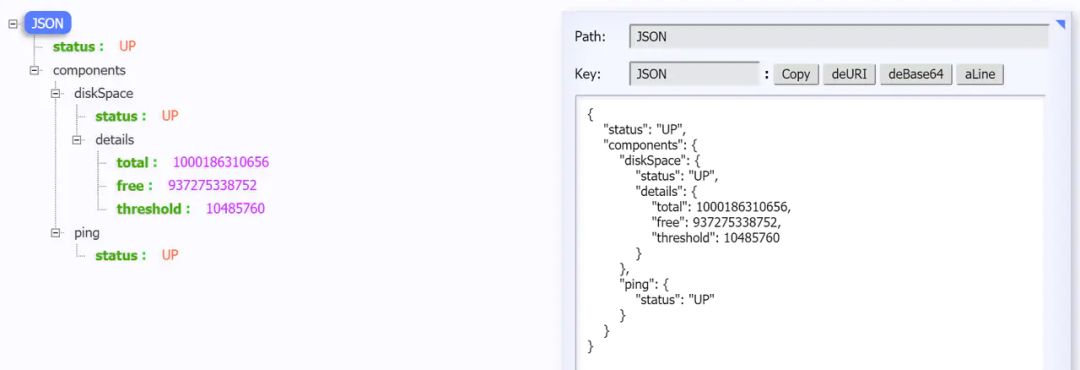
/health端点有很多自动配置的健康指示器:如redis、rabbitmq、db等组件。当你的项目有依赖对应组件的时候,这些健康指示器就会被自动装配,继而采集对应的信息。如上面的 diskSpace 节点信息就是 DiskSpaceHealthIndicator 在起作用。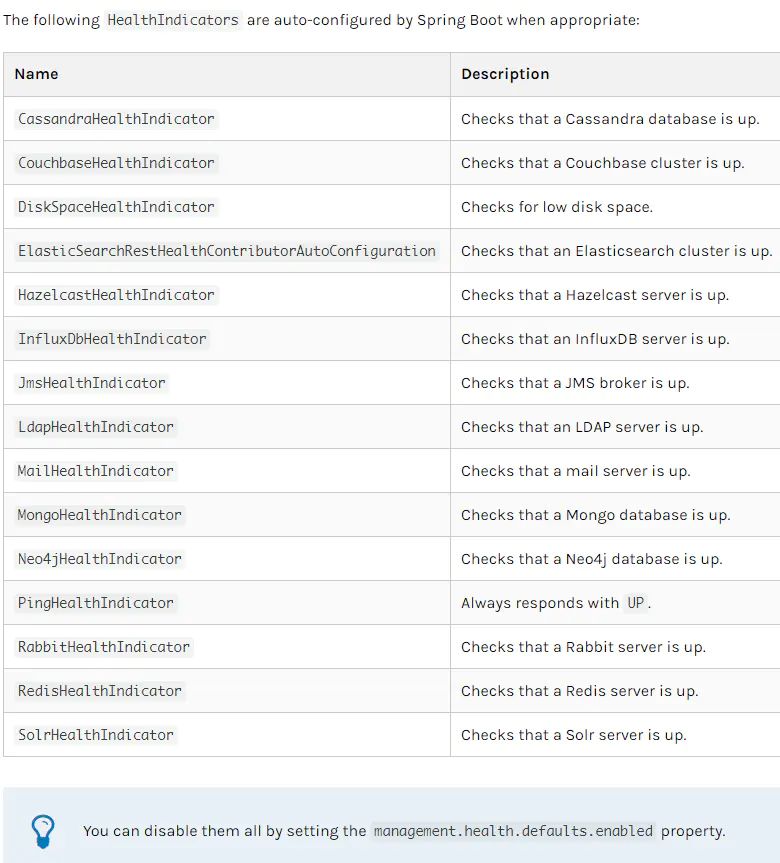
/health端点信息。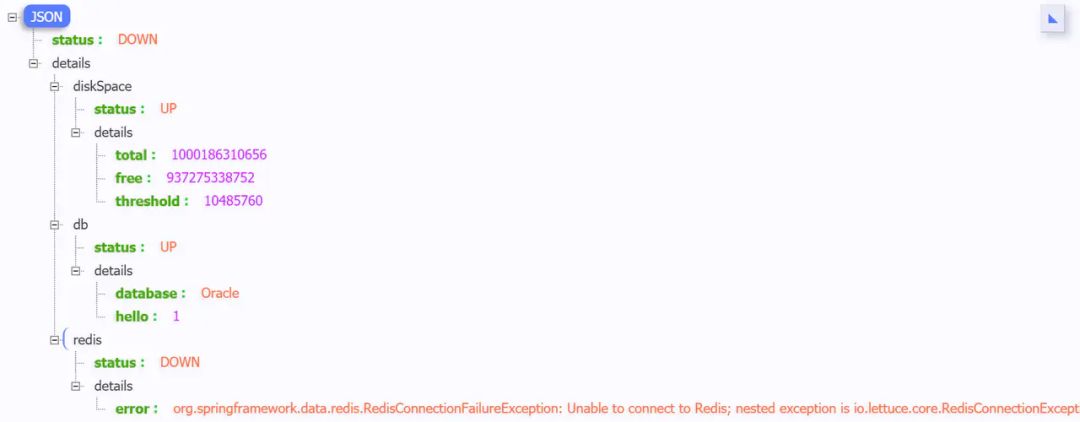
management.health.mongo.enabled: false
management.health.defaults.enabled: false⭐自定义 Health Indicator
HealthIndicator 接口或者继承 AbstractHealthIndicator类。
/** * @author Richard_yyf * @version 1.0 2020/1/16 */@ComponentpublicclassCustomHealthIndicatorextendsAbstractHealthIndicator{@Overrideprotectedvoid doHealthCheck(Health.Builder builder) throwsException{// 使用 builder 来创建健康状态信息// 如果你throw 了一个 exception,那么status 就会被置为DOWN,异常信息会被记录下来 builder.up().withDetail("app", "这个项目很健康").withDetail("error", "Nothing, I'm very good");}}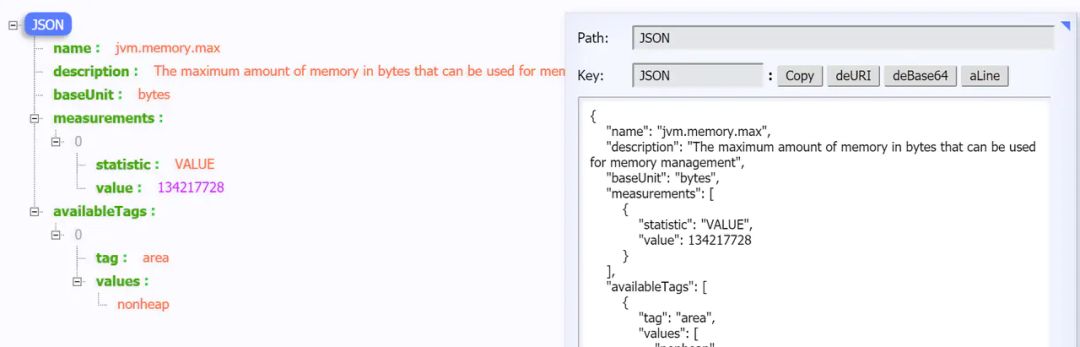
5.2
/metrics端点/metrics端点用来返回当前应用的各类重要度量指标,比如:内存信息、线程信息、垃圾回收信息、tomcat、数据库连接池等。
{"names": ["tomcat.threads.busy","jvm.threads.states","jdbc.connections.active","jvm.gc.memory.promoted","http.server.requests","hikaricp.connections.max","hikaricp.connections.min","jvm.memory.used","jvm.gc.max.data.size","jdbc.connections.max",....]}
http://localhost:8080/actuator/metrics/{MetricName}/actuator/metrics/jvm.memory.max,返回信息如下: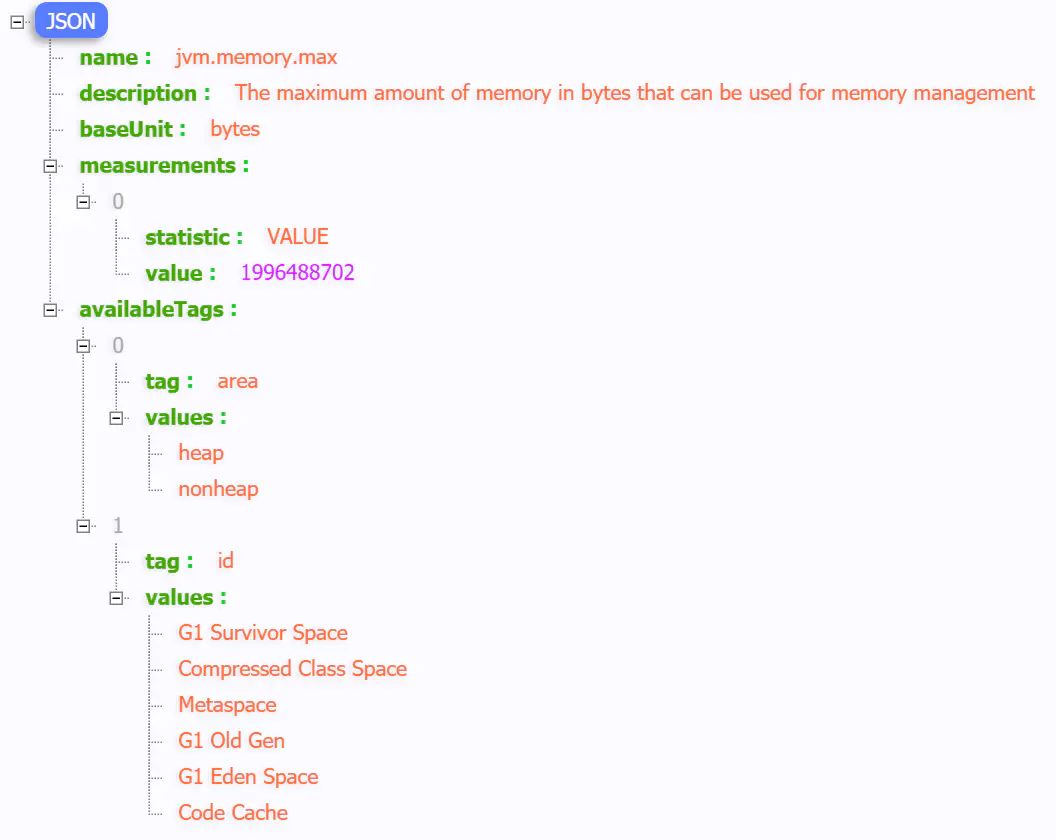

5.3
/loggers端点/loggers 端点暴露了我们程序内部配置的所有logger的信息。我们访问 /actuator/loggers可以看到,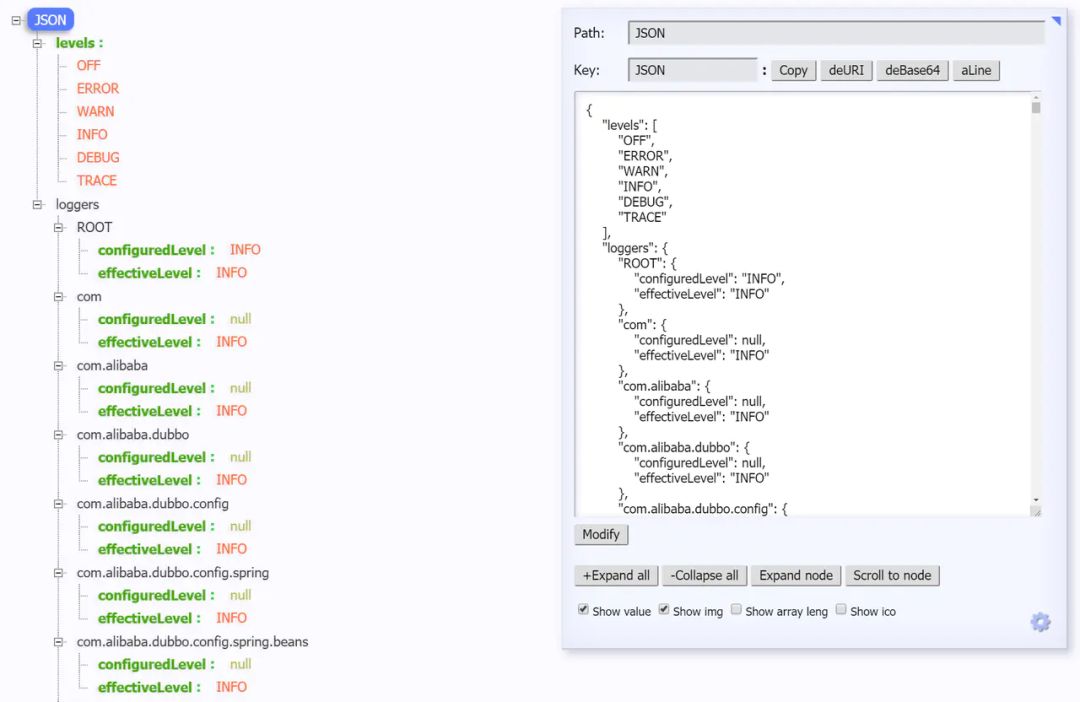
http://localhost:8080/actuator/loggers/{name}root logger, http://localhost:8080/actuator/loggers/root
{
"configuredLevel": "INFO",
"effectiveLevel": "INFO"
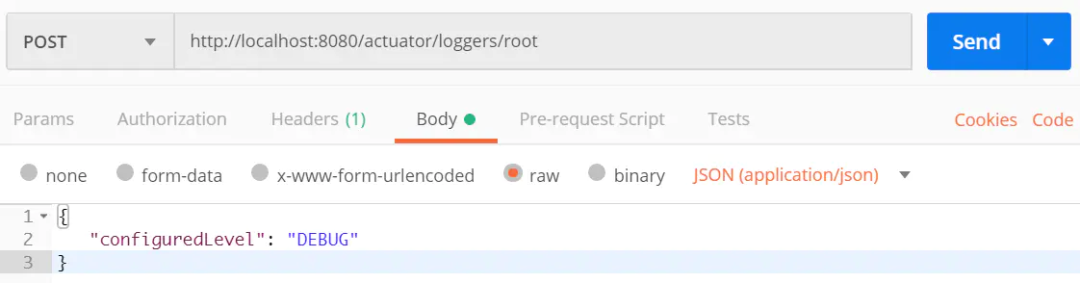
}⭐改变运行时的日志等级
/loggers端点我最想提的就是这个功能,能够动态修改你的日志等级。root logger的日志等级。我们只需要发起一个URL 为 http://localhost:8080/actuator/loggers/root的 POST请求,POST报文如下:
{"configuredLevel":
"DEBUG"
}
null5.4
/info端点/info端点可以用来展示你程序的信息。我理解过来就是一些程序的基础信息。并且你可以按照自己的需求在配置文件 application.properties中个性化配置(默认情况下,该端点只会返回一个空的json内容。):
info.app.name=actuator-test-demoinfo.app.encoding=UTF-8info.app.java.source=1.8info.app.java.target=1.8# 在 maven 项目中你可以直接用下列方式引用 maven properties的值# info.app.encoding=@project.build.sourceEncoding@# info.app.java.source=@java.version@# info.app.java.target=@java.version@http://localhost:8080/actuator/info:
{"app": {"encoding": "UTF-8","java": {"source": "1.8.0_131","target": "1.8.0_131"},"name": "actuator-test-demo"}}5.5
/beans端点/beans端点会返回Spring 容器中所有bean的别名、类型、是否单例、依赖等信息。http://localhost:8080/actuator/beans,返回如下: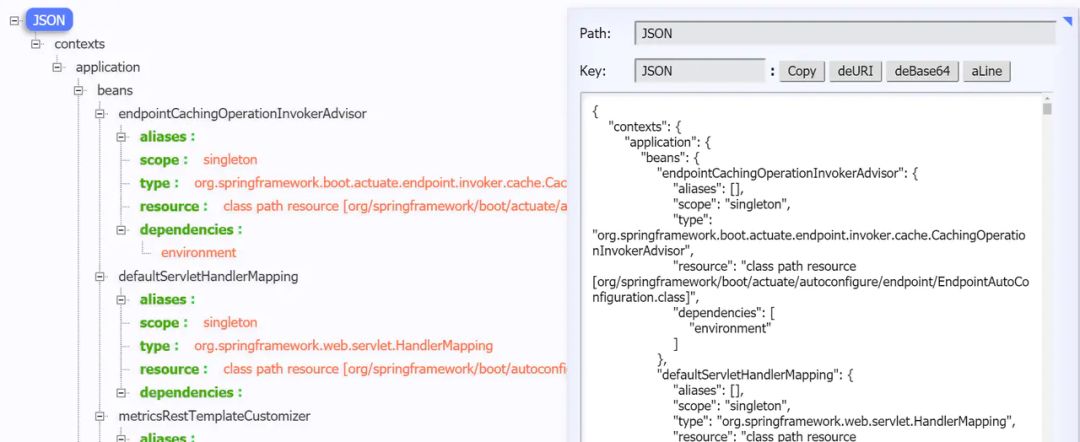
5.6
/heapdump 端点http://localhost:8080/actuator/heapdump会自动生成一个 Jvm 的堆文件 heapdump。我们可以使用 JDK 自带的 Jvm 监控工具 VisualVM 打开此文件查看内存快照。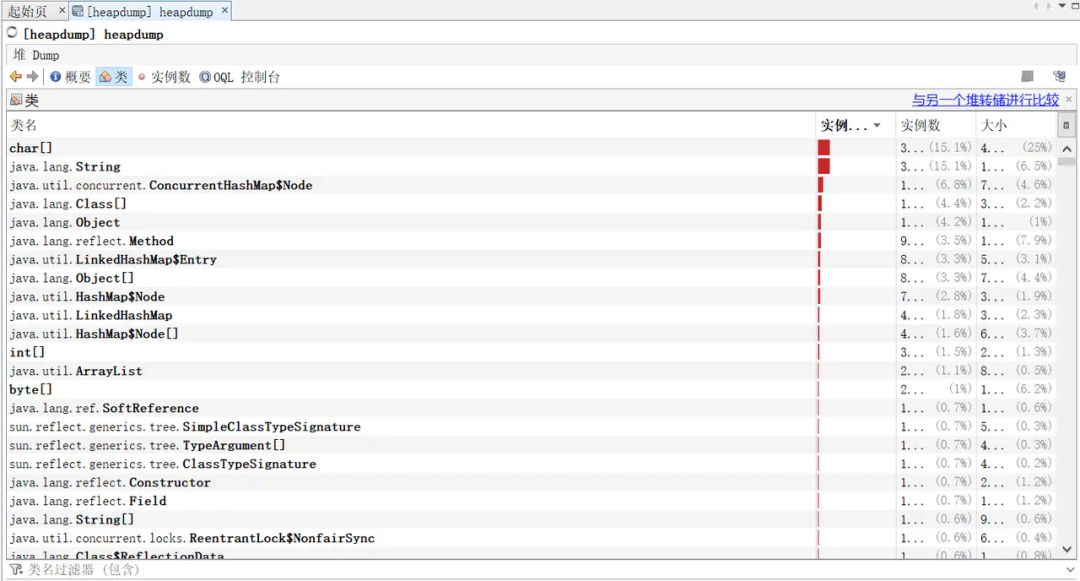
5.7
/threaddump 端点http://localhost:8080/actuator/threaddump返回如下: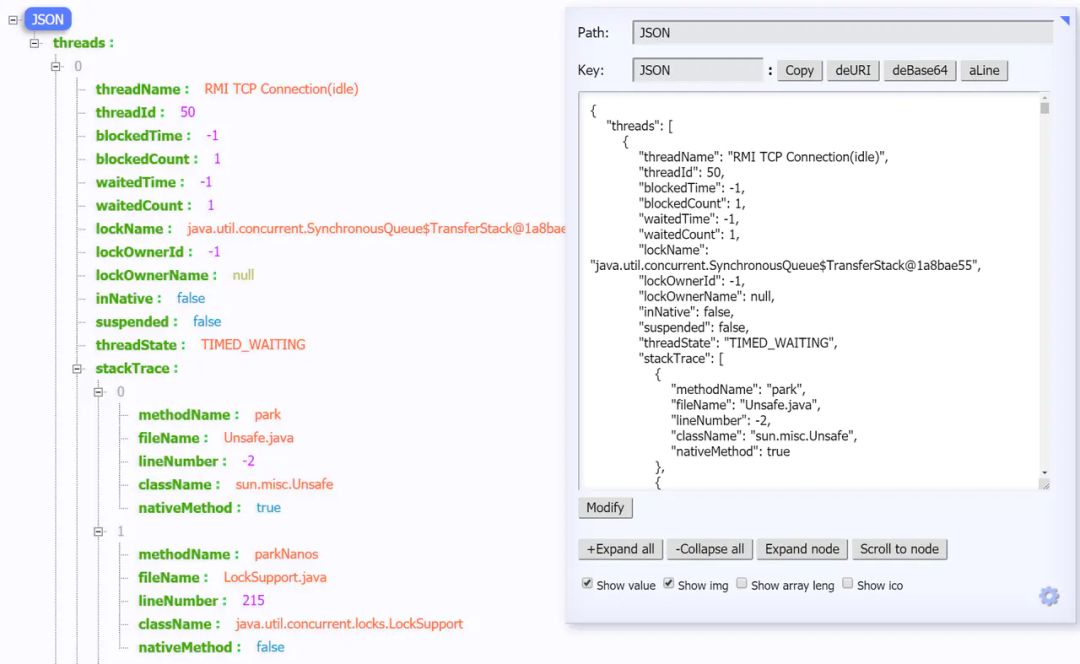
5.8
/shutdown端点
management.endpoint.shutdown.enabled=truehttp://localhost:8080/actuator/shutdown发起 POST请求。返回信息:
{
"message": "Shutting down, bye..."
}
整合Spring Security 对端点进行安全校验
<dependency><groupId>org.springframework.boot</groupId><artifactId>spring-boot-starter-security</artifactId></dependency>
import org.springframework.boot.actuate.autoconfigure.security.servlet.EndpointRequest;import org.springframework.boot.actuate.context.ShutdownEndpoint;import org.springframework.boot.autoconfigure.security.servlet.PathRequest;import org.springframework.context.annotation.Configuration;import org.springframework.security.config.annotation.web.builders.HttpSecurity;import org.springframework.security.config.annotation.web.configuration.WebSecurityConfigurerAdapter;/** * @author Richard_yyf */@ConfigurationpublicclassActuatorSecurityConfigextendsWebSecurityConfigurerAdapter{/* * version1: * 1. 限制 '/shutdown'端点的访问,只允许ACTUATOR_ADMIN访问 * 2. 允许外部访问其他的端点 * 3. 允许外部访问静态资源 * 4. 允许外部访问 '/' * 5. 其他的访问需要被校验 * version2: * 1. 限制所有端点的访问,只允许ACTUATOR_ADMIN访问 * 2. 允许外部访问静态资源 * 3. 允许外部访问 '/' * 4. 其他的访问需要被校验 */@Overrideprotectedvoid configure(HttpSecurity http) throwsException{// version1// http// .authorizeRequests()// .requestMatchers(EndpointRequest.to(ShutdownEndpoint.class))// .hasRole("ACTUATOR_ADMIN")// .requestMatchers(EndpointRequest.toAnyEndpoint())// .permitAll()// .requestMatchers(PathRequest.toStaticResources().atCommonLocations())// .permitAll()// .antMatchers("/")// .permitAll()// .antMatchers("/**")// .authenticated()// .and()// .httpBasic();// version2 http.authorizeRequests().requestMatchers(EndpointRequest.toAnyEndpoint()).hasRole("ACTUATOR_ADMIN").requestMatchers(PathRequest.toStaticResources().atCommonLocations()).permitAll().antMatchers("/").permitAll().antMatchers("/**").authenticated().and().httpBasic();}}application.properties的相关配置如下:
# Spring Security Default user name and passwordspring.security.user.name=actuatorspring.security.user.password=actuatorspring.security.user.roles=ACTUATOR_ADMIN
原文链接:
https://juejin.im/post/5e2179def265da3e152d2561

